|
|---|
 Industrial Group of the BCA
July 1998 - techniques
Useful Camera Techniques - the Wallace-Ward (Marconi) thin film cameraI know of at least two other users of this excellent camera, and we are agreed as to its simplicity and utility in examining not only thin films but also sample bulk properties. Orientation, crystallite size, phase identification, sequencing of layers are all possible. It provides a useful screening tool before applying more instrumented techniques since, as with most camera techniques, it allows for a comprehensive qualitative view of the crystalline state.
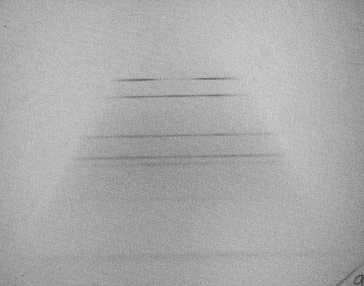
The diagram shows the layout of this cylindrical camera, and the position (L) of the observed reflection is related to the camera radius and wavelength only (1&2). The rotating sample is presented to the X-ray beam at a selected angle of incidence and thin films or surface phases are enhanced by the low(30°) incident angle. A disadvantage is the lack of a fiducial mark on the film, but this is easily overcome by either identifying a known reflection and referencing the other lines to this, or by using the cut-off position of the X-ray shadow, or by use of Keith Roger's Texcam program (below). Orientation and crystallite size effects are immediately apparent from the film and detail differences at the extremities of the diffraction lines may be used to deduce the sequence of thin layers present. Single crystal substrates offer excellent samples and epitaxial growth problems have been studied. Mary Vickers has offered the example of cold rolled nickel, which has a complex texture, picture below.
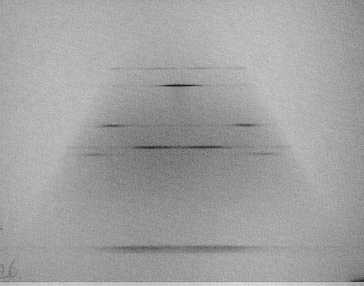
Suitable heat treatment converts the texture to "cubic" with the three axes of the cube aligned to the rolling, transverse and sheet normal. This form is of considerable academic and industrial interest, picture below:
Keith Rogers has written an excellent PC program (Texcam) which simulates the expected pattern, complete with orientation and intensity effects. Applying this to the nickel problem, one obtains:
Presenting anything other than a simple pattern in this newsletter is difficult, but it can be seen how much information is gained from a single experiment with a minimum of effort and at low cost. For those with a Weissenberg camera lurking in the cupboard, Judith Milledge has told me that it can be rejigged to perform a similar function as the Marconi camera. A. L. Mackay has also adapted a similar camera for measuring preferred orientation in wires (3). references:
Contacts for further information:
Bruce Fox A guide to Self testing your diffractometerPlease check out an improved version of the SpreadSheet in a News Report. A more detailed version of this guide is available as a 92kb .PDF file An Intensity Round Robin was completed in the UK in 1997. It covered Philips and Siemens (now Bruker) diffractometers and generated a useful resource for the evaluation of instrument performance. To make this data widely available so that anyone could test their own machine a series of self test files were produced. This guide explains how to use these files to run the tests in your own laboratory. Equipment required:
Self test files:The files you need can be downloaded from the following list.
    File          Size     Use


  README.TXT      3 kb    explains tests

  RRint.PDF     225 kb    UK Round Robin report

  RROBCUTP.XLS  153 kb    Cu tube Data Template

  RROBCOTP.XLS  152 kb    Co tube Data Template

  UKDEMO.XLS    154 kb    A completed data example
Running the tests Print a copy of RRint.PDF, the UK Round Robin report. Comparing Results. Conclusions. E-mail Dave Taylor at: [email protected] Dave Taylor. |
|